We're excited to announce the launch of our new reporting Dashboard on ZenHR. ZenHR’s customizable Dashboard provides a visual representation of your HR Key Performance Indicators (KPIs) and other important metrics, so you can make better and more informed decisions.
The Dashboard is shown on the homepage of your ZenHR account and can only be viewed by the team members with the right permissions, including Super Admins, HR Admins, Read-Only HR, Recruiters, Financial Officers, and Read-Only Financial Employees. Please note that employees will not be able to access or view your Dashboard.
TABLE OF CONTENTS
- Dashboard Main Features
- How To Add a New Dashboard to the Home Page
- How To Add Widgets To New Dashboard
- Customize your Dashboard
- How to Edit and Delete Widgets
- How To Manage My Dashboards List
Dashboard Main Features:
ZenHR’s dashboard allows you to view various insightful HR metrics and reports, which helps you better predict which aspects of your HR department need to be improved. Here are the main features of ZenHR’s Dashboard:
- Provides real-time analytics and visibility of key HR metrics.
- Simplifies complex HR data sets allowing users to analyze data, visualize trends, forecast HR requirements, and uncover critical insights.
- Shares real-time and actionable data, allowing your key HR teams to have a single view of the data for more effective collaboration.
- Filters information that is relevant to the users' needs.
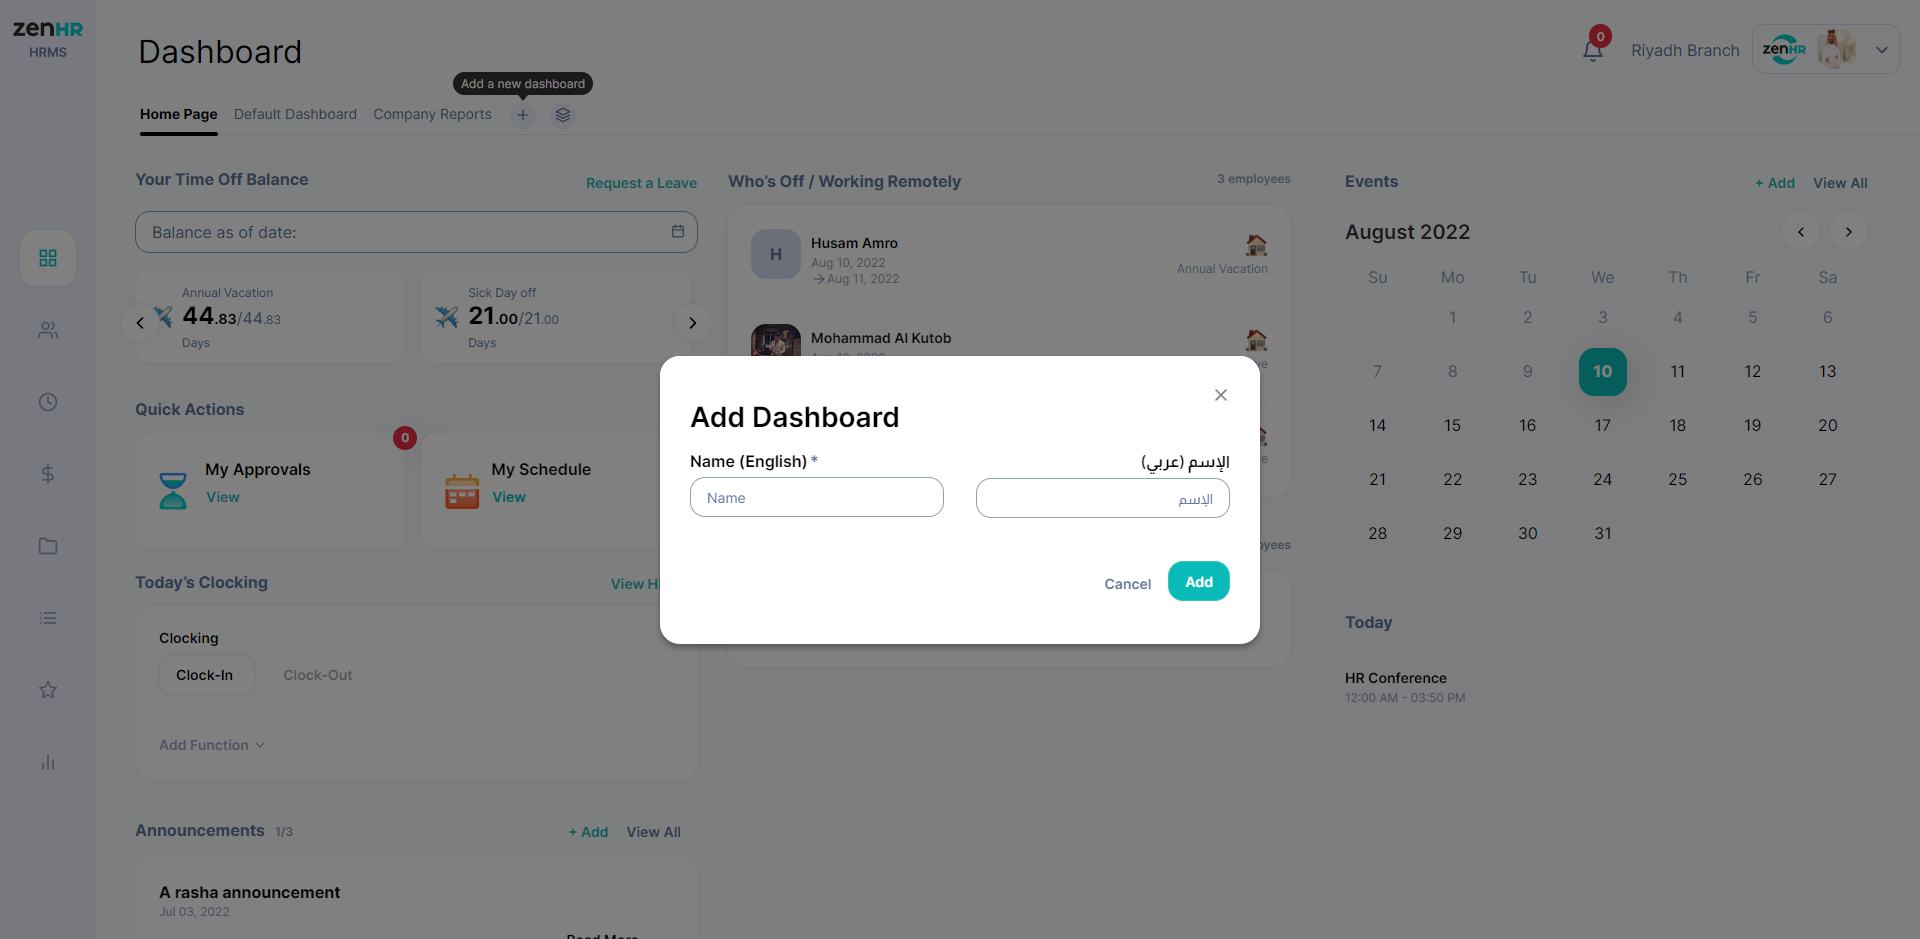
How To Add a New Dashboard to the Home Page
Home Page → Add a New Dashboard
To add a new Dashboard, click the (+) button beside Home Page on the newly added tabs bar. A pop-up window will appear for you to fill in the new dashboard’s details.
How To Add Widgets To New Dashboard
The main elements that make up a Dashboard are widgets. They help you in summarizing and visualizing the data pulled from ZenHR. You can add different types of widgets to display various HR information and reports.
You can add a new widget to your dashboard in two different ways:
Option 1: If the dashboard has been newly created and has no widgets yet, click the “Add Widget” button in the middle of the page.

Option 2: If the dashboard has one or more widgets, the “Add Widget” button will be on the top right corner of the page.

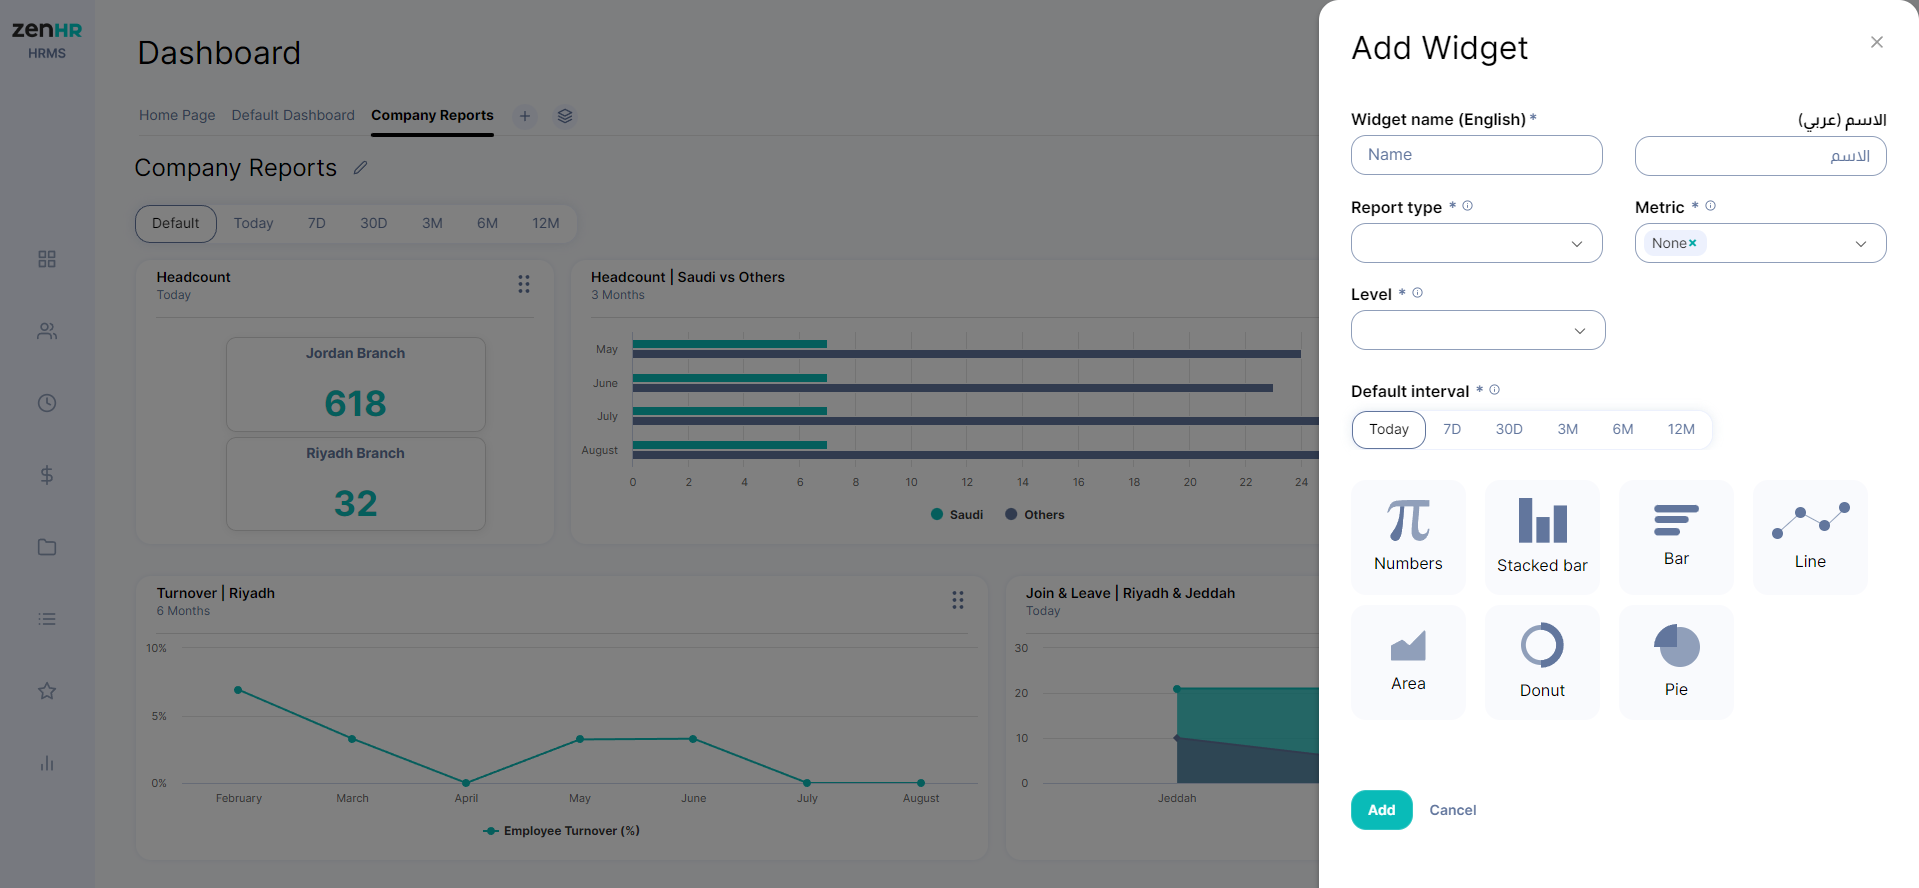
When you add a new widget, a slider will appear, allowing you to fill out the following report elements:
- Report Name: In both languages (English and Arabic).
- Report Type: Choose the report type from the list.
- Metric: Select the measurement criteria for your report (Gender, Nationality, Work Type, Saudi, or Other Nationalities).
- *Note: The metric field will only appear If the report type relies on a metric; otherwise, it will be hidden.
- Level: The organizational level of the report (Company, Branch, Work Location, Department, Group, Section, Project, Position). Once you specify the level, another drop-down will appear with options related to the chosen level and the user role, and the assigned user permissions (Ex: Branch: Riyadh & Amman)
- Interval: The period you’d like to base your report on (Today, 7D*, 30D, 3M*, 6M, 12M).
- *D = Day, M = Month
- Chart Type: Choose the desired type of chart (Numbers, Bar, Line, Area, Pie, Donut, Stacked Bar).
Customize your Dashboard
Once you’ve added all the desired reports, you can fully customize each report's appearance to match your business needs and priorities. Here are the customization options that you can use:
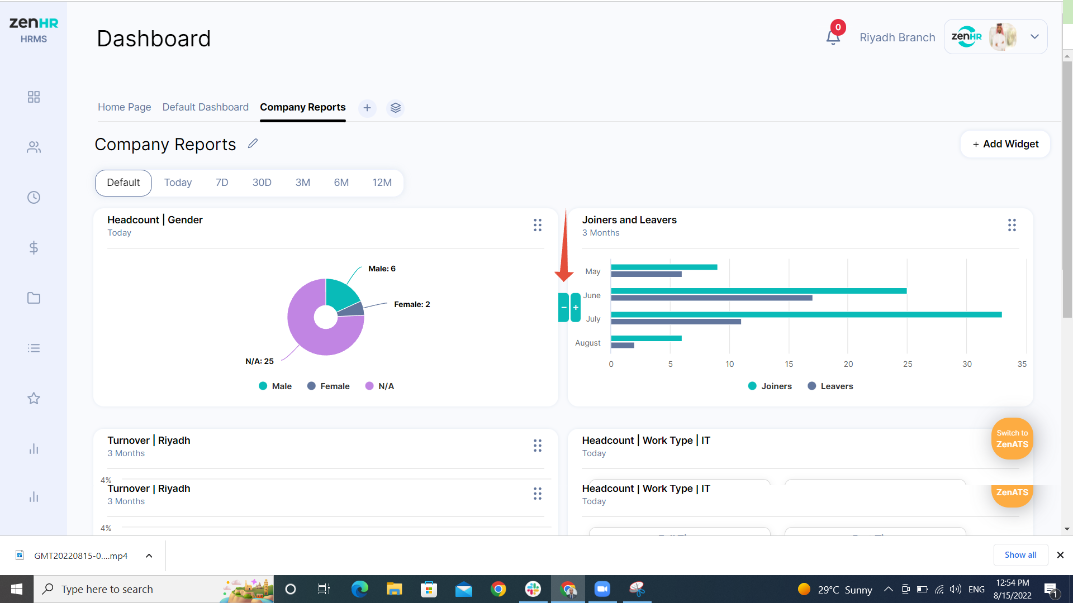
Re-sizing Widgets
To resize a widget, use the (+) and (-) buttons that are displayed around the widget when you hover over it. Use these buttons to expand or shrink the widget to the desired size.
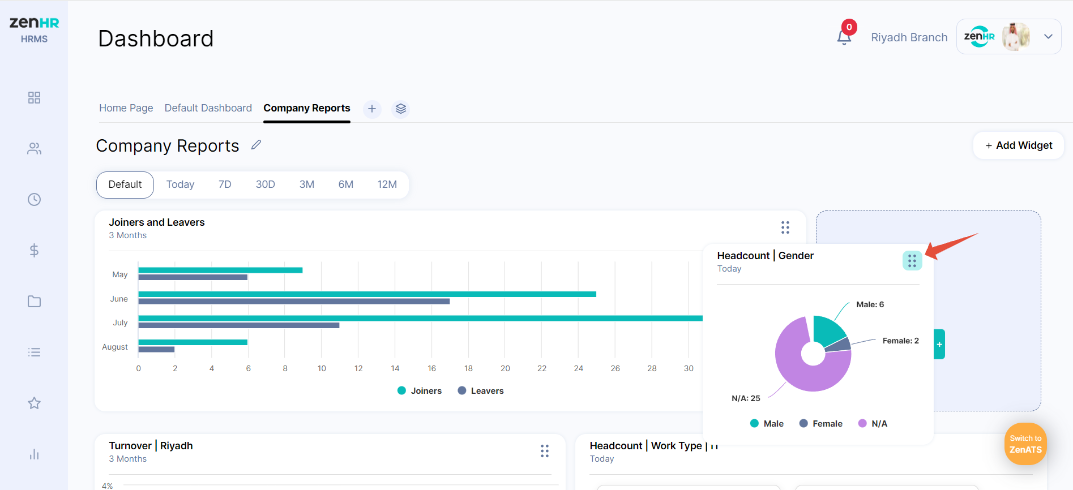
Re-arranging Widgets
To change the order of the widgets, drag and drop the vertical ellipsis icon (⋮⋮) on the top right of each widget.
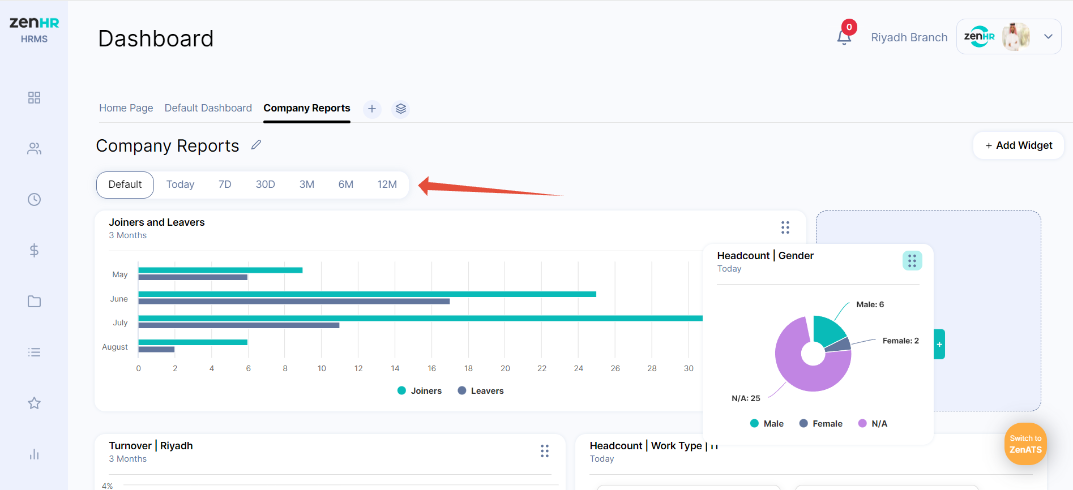
Changing the Dashboard’s Interval for All Widgets
To apply a specific time interval to all the created widgets, you can simply go to the interval bar at the top of the page and select the desired period. The selected interval will be automatically applied to all widgets.
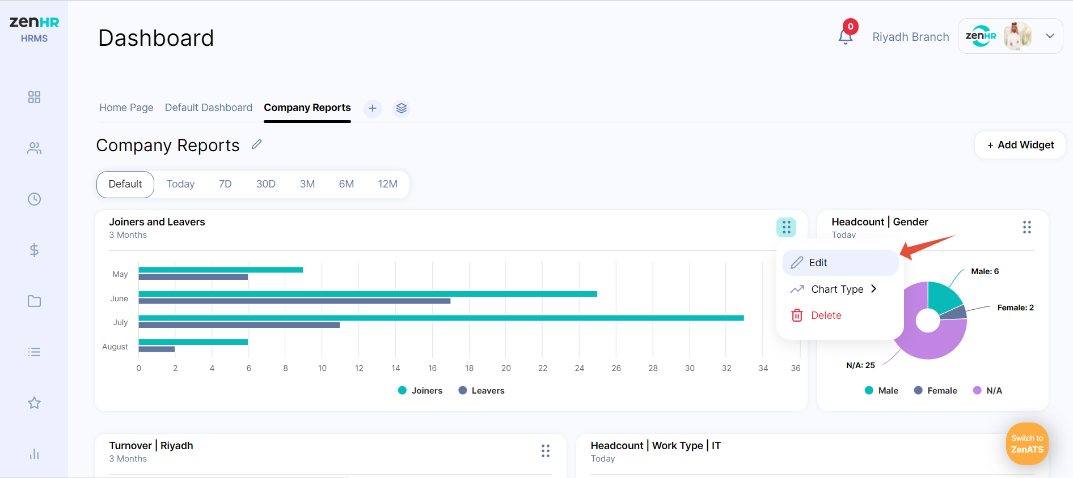
How to Edit and Delete Widgets
Vertical Ellipsis Icon (⋮⋮) → Edit → Edit Widget Page
You can browse all your report fields and modify them as desired. All changes will be reflected on the dashboard when you click the “Save” button.
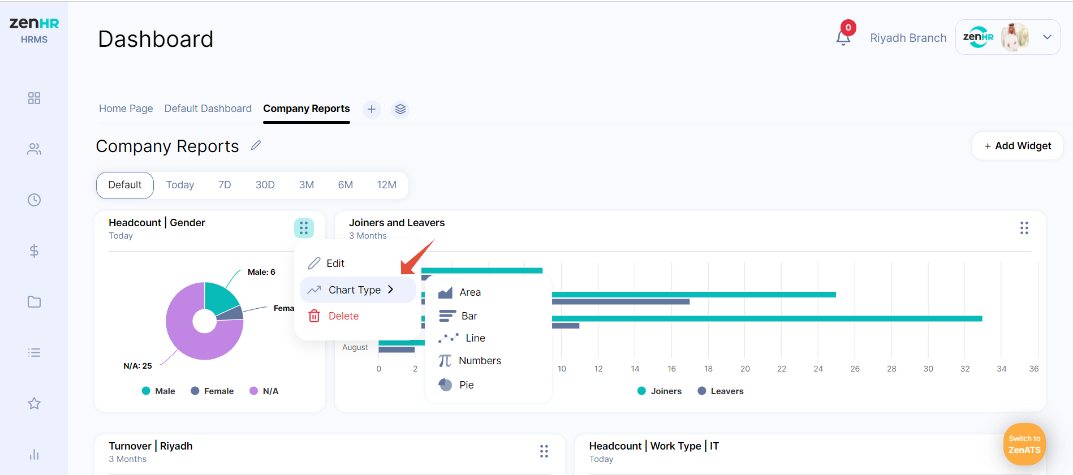
Vertical Ellipsis Icon (⋮⋮) → Chart Type
For clearer data visualization, you can change the chart type of your report from the dashboard’s main page.
Vertical Ellipsis Icon (⋮⋮) → Delete
You can also delete your widgets by clicking the “Delete” button by clicking the Vertical Ellipsis Icon (⋮⋮), then a pop up message will appear to confirm that you would like to delete the widget.

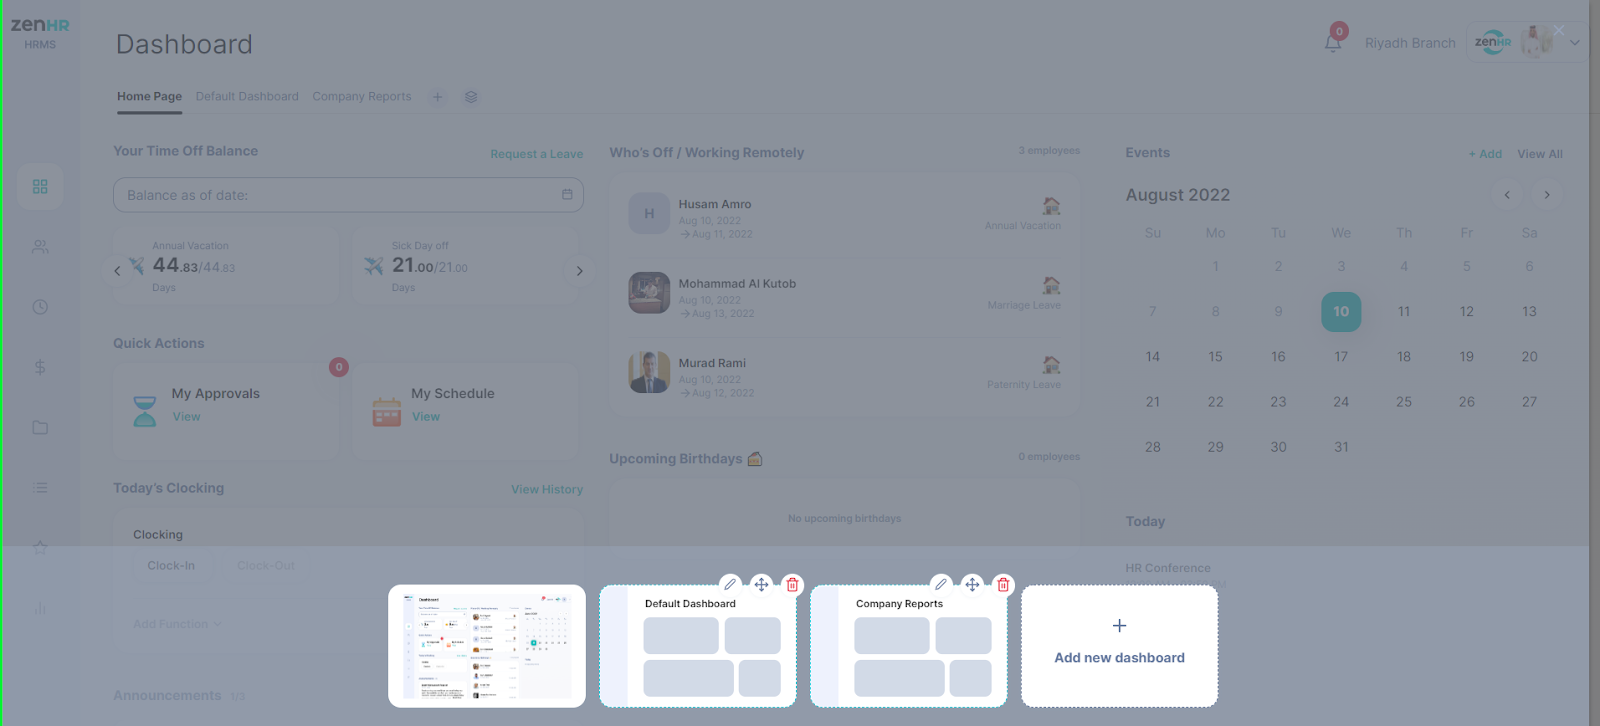
How To Manage My Dashboards List
Home Page → Manage Dashboards
You can drag and drop your dashboards to change their order. You can also delete any dashboards you no longer need by clicking the “Manage Dashboards” button, then click “delete” on the dashboard you’d like to remove.
![]()